Technology
Where the points come from, how the system knows where it was at the moment of measurement, and why a laser scanner alone is not enough for surveying. No jargon, in four steps.


Step 1: LiDAR
LiDAR sends laser pulses and measures how long they take to come back after hitting an object. That time gives the distance to the surface the beam hit.
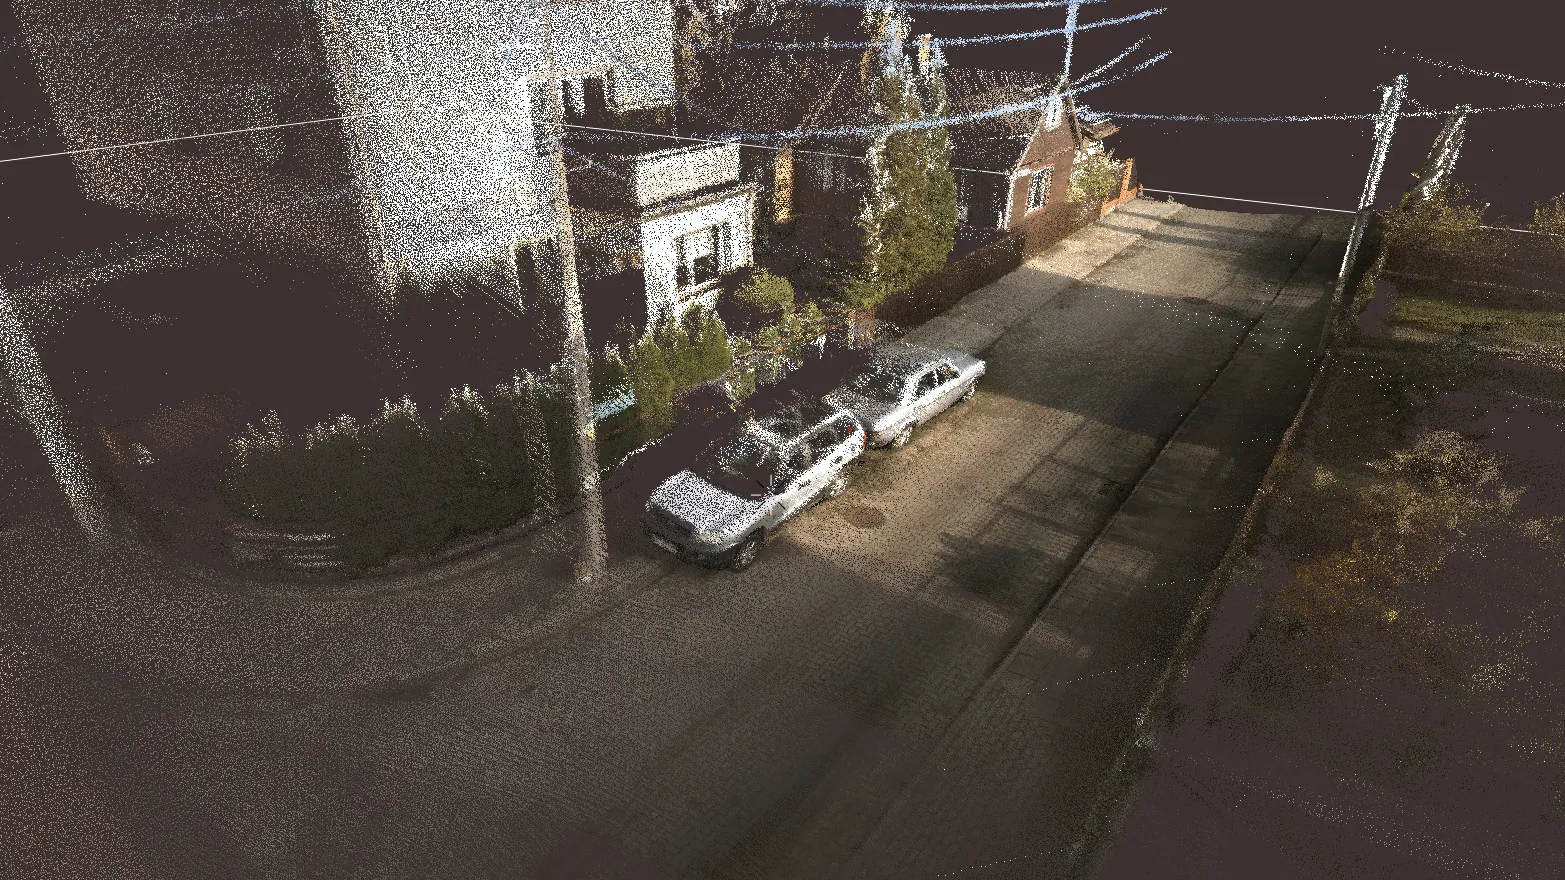
The BP-32 scanner has 32 beams rotating 20 times per second, which gives up to 640,000 measurements per second. Each point describes a piece of terrain, a building, a road, a kerb or a tree — anything the scanner can see within its 300 m range.
Step 2: position and orientation
Distance alone is not enough. For each point to land in the right place on the map, the system combines data from four sources at every moment.
The device position in the project coordinate system, e.g. PL-2000, with RTK correction.
Motion, tilt and orientation of the sensor head, measured 1000 times per second.
Compares consecutive parts of the scan and refines the walking trajectory.
Distances to objects, which build up the dense point cloud.

Step 3: SLAM
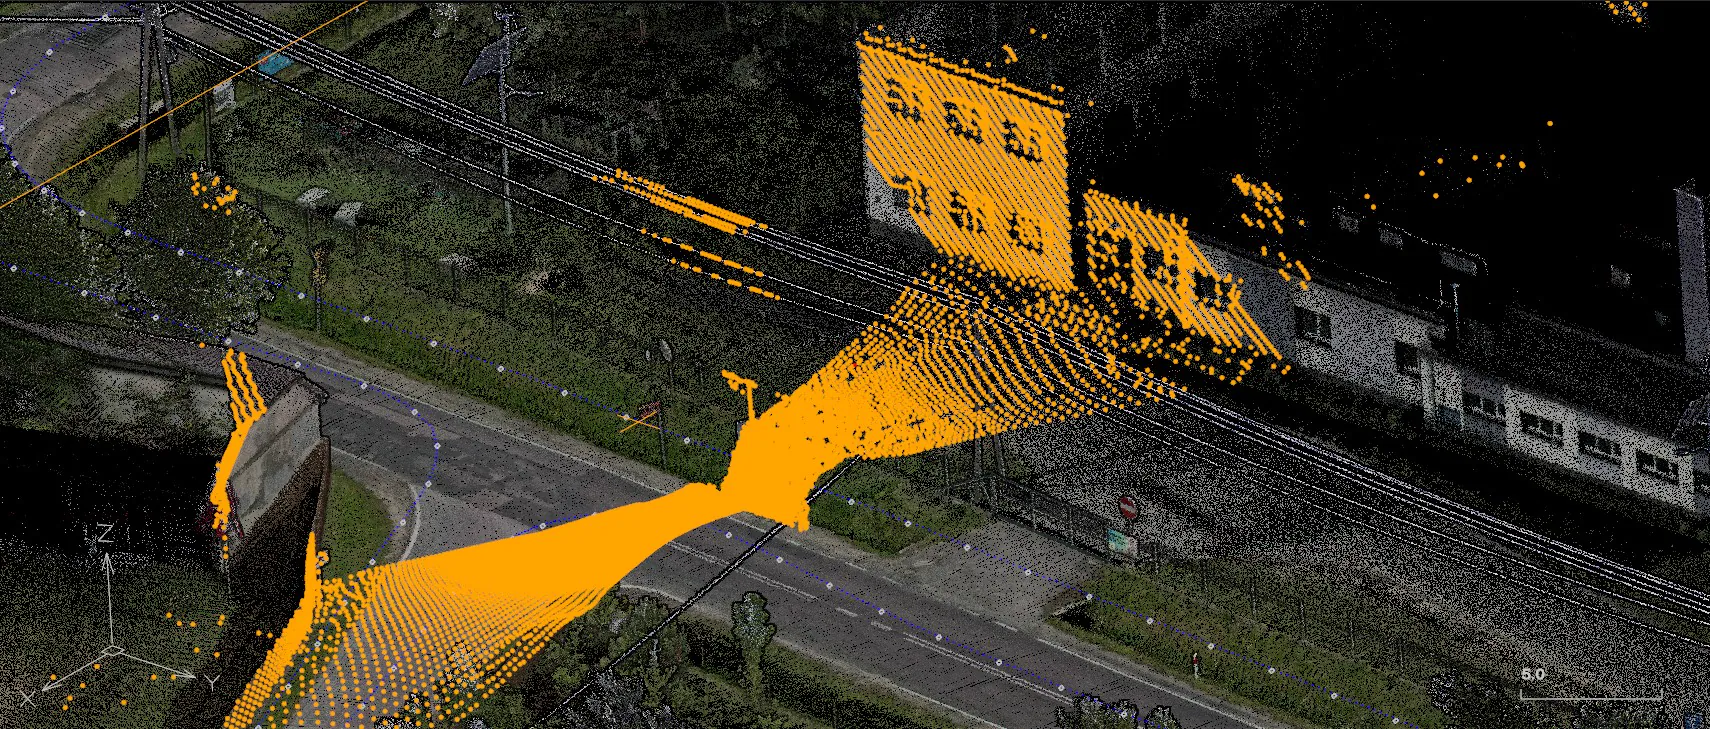
SLAM analyses consecutive parts of the point cloud and looks for shared features of the surroundings. This corrects the position and orientation of the moving scanner — especially where the GNSS signal is weaker: between buildings, under trees, next to infrastructure.
In a typical survey you do not need to set out calibration points, as you often do for drone or aircraft flights. On linear jobs you can measure a few GNSS check sections, but it is not required to start work.
The system calculates the trajectory automatically and works straight away in the target coordinate system.
Step 4: the result
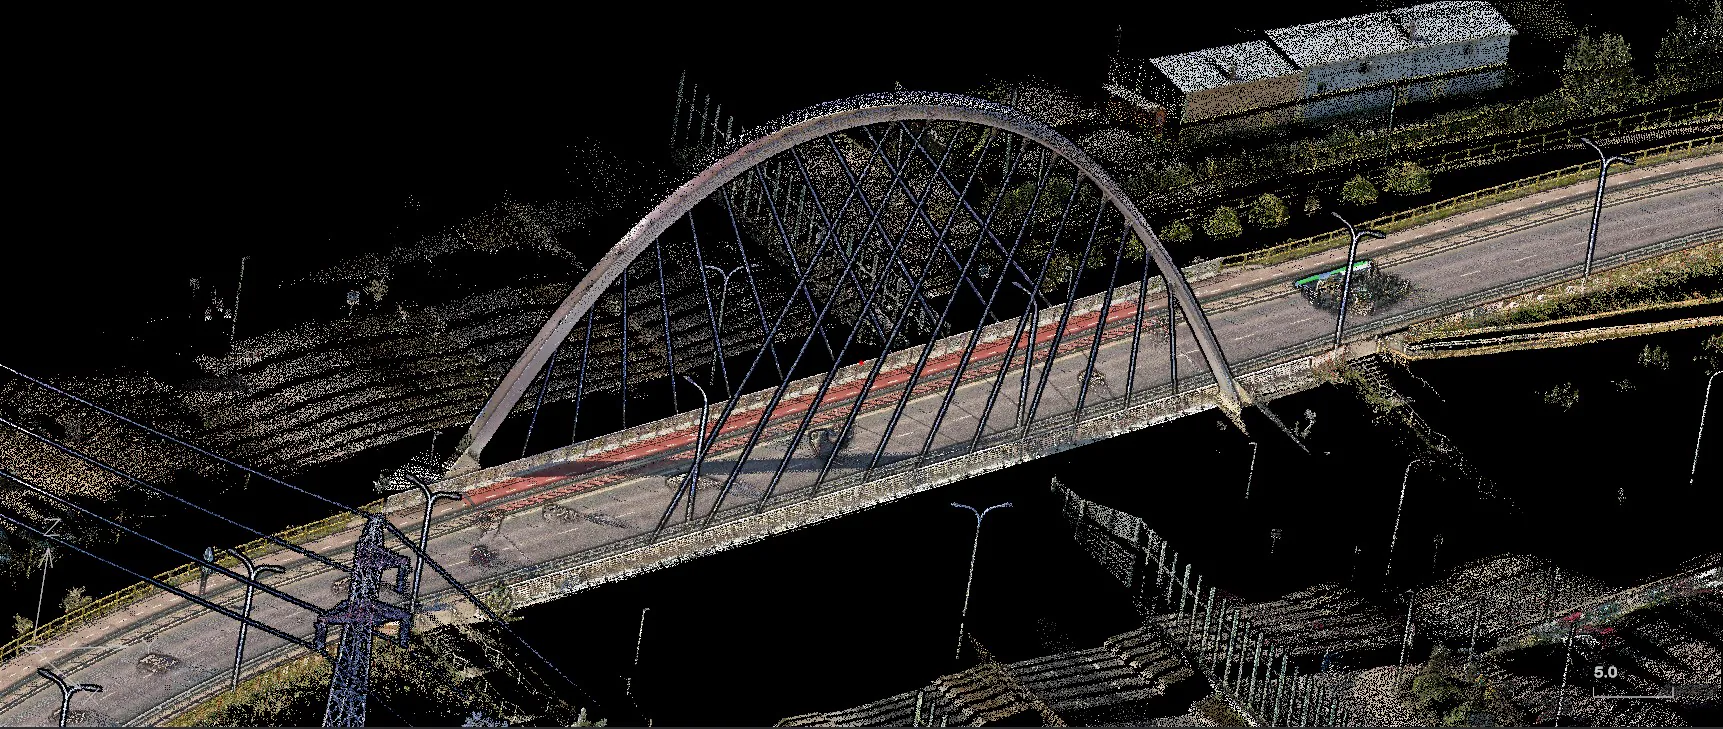
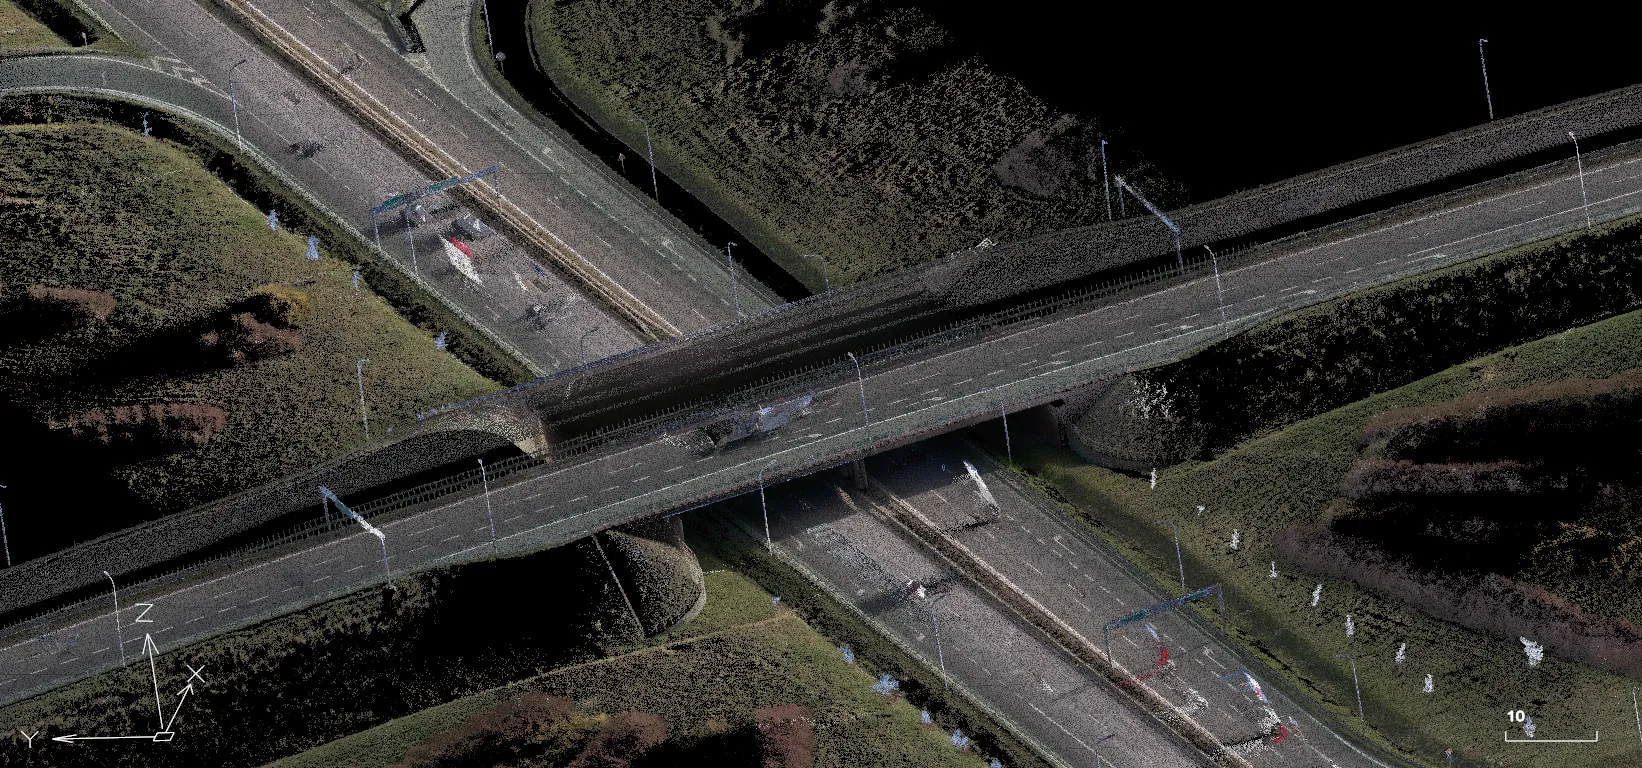
A survey gives you more than a file of points: photos and 360° panoramas, the device orientation, the walking trajectory and a complete data set for processing.
After processing, the data goes into GeoOffice. There you work with the point cloud, panoramas, cross-sections, the map and reports in one program.
See GeoOffice
Values from the BP-32 specification. They show the scale of data collected during a single walk.